

Governments, corporations, and everyday citizens are increasingly turning to solar not only to cut carbon emissions but also to reduce energy costs, boost grid independence, and stimulate green economic growth.
With solar panels now more efficient and affordable than ever, the global capacity has surged past 2.2 terawatts as of 2024… a 33% year-over-year growth that signals we’re in the midst of a solar revolution.
But not all nations are progressing at the same pace. This listicle explores the top five countries leading in solar power adoption through sheer capacity, innovative policies, or per capita penetration. These leaders are transforming their energy landscapes while influencing global climate policy, market dynamics, and technological innovation.
Jump to:
Honorable Mentions
- Japan: Once a leader, Japan continues to invest in solar but has been surpassed by India in total capacity.
- Netherlands: Leads the EU in solar capacity per capita, emphasising rooftop solar installations.
- Spain: Achieved a new quarterly high with solar comprising 15% of its energy mix in early 2025.

Top 5 Countries by Total Output
1. China – Global Solar Superpower
- Total Installed Capacity (as of the end of 2024): ~887 GW
- Per Capita Solar Capacity: Approximately 620 watts per person
- Share of Global Solar Capacity: Approximately 40%
Key Highlights:
Record-Breaking Growth: In 2024, China added a record 277 GW of new solar capacity, marking a 45.2% year-over-year increase.
Major Solar Projects: China is constructing the “Solar Great Wall” in the Kubuqi Desert, aiming for 100 GW capacity by 2030 .
Government Initiatives: China’s rapid expansion is driven by massive state investments and a focus on energy self-sufficiency.
Manufacturing Capacity: The country dominates the global solar supply chain, producing over 80% of the world’s solar panels.
Global Standing: With these developments, China has solidified its position as the world’s leading solar market, both in total capacity and manufacturing.
2. United States – Innovation and Distributed Growth
- Total Installed Capacity (as of the end of 2024): ~239 GW
- Per Capita Solar Capacity: Approximately 720 watts per person
- Share of Global Solar Capacity: Approximately 11%
Key Highlights:
Record-Breaking Growth: In 2024, the United States added a record 50 GW of new solar capacity, marking the largest single-year addition of any energy technology to the grid in over two decades.
Diverse Market Segments: The utility-scale segment saw historic gains, growing by 33% year-over-year with a record 41.4 GW of installed capacity. The community and commercial solar markets also set annual records, growing by 35% and 8%, respectively.
Manufacturing Expansion: Domestic solar module manufacturing capacity grew an unprecedented 190% year-over-year, from 14.5 GW at the end of 2023 to 42.1 GW at the end of 2024, surpassing 50 GW in early 2025.
Policy Support: Growth is propelled by federal incentives, state-level policies, and declining solar panel costs. The Inflation Reduction Act and various state programs have played significant roles in accelerating solar adoption.
Distributed Solar Adoption: Significant adoption of residential and commercial rooftop solar systems continues, with states like California, Texas, and Florida leading in new installations.
3. India – Rapid Expansion in Solar Infrastructure
- Total Installed Capacity (as of January 2025): ~100.33 GW
- Per Capita Solar Capacity: Approximately 70 watts per person
- Share of Global Solar Capacity: Approximately 7%
Key Highlights:
Record-Breaking Growth: In 2024, India added a record 24.5 GW of new solar capacity, more than doubling its additions from the previous year. This surge was driven by large-scale utility projects, rooftop installations, and off-grid solutions.
Major Solar Parks: India is home to some of the world’s largest solar parks, including the Bhadla Solar Park in Rajasthan, which spans over 14,000 acres and has a capacity of 2.25 GW.
Government Initiatives: The Indian government has launched several schemes to promote solar energy adoption, such as the PM Surya Ghar: Muft Bijli Yojana, which aims to install rooftop solar panels in millions of homes, and the Solar Park Scheme, which facilitates the development of large-scale solar parks.
Manufacturing Capacity: The country has significantly ramped up its solar module manufacturing capacity, reaching 60 GW in 2024, with plans to expand to 100 GW by 2030.
Global Standing: With these developments, India has solidified its position as the third-largest solar market globally, following China and the United States.
4. Germany – Pioneering Solar Integration
- Total Installed Capacity (as of the end of 2024): ~99.3 GW
- Per Capita Solar Capacity: Approximately 1,192 watts per person
- Share of Global Solar Capacity: Approximately 4.5%
Key Highlights:
Record-Breaking Growth: In 2024, Germany added 16.2 GW of new solar capacity, marking a significant increase from the 14.28 GW added in 2023.
Diverse Solar Installations: By December 2024, Germany operated more than 4 million PV systems. Two-thirds of the systems installed in 2024 were residential and commercial arrays, while the rest were ground-mounted projects.
Government Initiatives: Germany’s rapid expansion is driven by strong policy frameworks and public support, sustaining growth despite challenges.
Global Standing: With these developments, Germany has solidified its position as Europe’s leading solar market, both in total capacity and per capita adoption.
5. Australia – World Leader in Per Capita Solar Use
- Total Installed Capacity (as of the end of 2024): ~40.7 GW
- Per Capita Solar Capacity: Approximately 1,600 watts per person
- Share of Global Solar Capacity: Approximately 1.8%
Key Highlights:
Rooftop Solar Dominance: Australia leads the world in rooftop solar adoption, with over 3.92 million PV installations contributing to a combined capacity exceeding 40.7 GW.
Record Installations: In 2024, Australians installed approximately 3 GW of new rooftop solar capacity, marking the fifth consecutive year with over 300,000 new systems added.
Significant Contribution to Energy Mix: Rooftop solar accounted for 12.4% of Australia’s total energy generation in 2024, highlighting its critical role in the nation’s electricity supply.
Government Initiatives: The Australian government has set an ambitious target of achieving 82% renewable electricity by 2030, with solar energy playing a pivotal role in this transition.
Home Battery Support: To improve energy storage capabilities, the government announced a $2.3 billion initiative to subsidise household batteries, aiming to reduce installation costs by 30% and support the integration of rooftop solar systems.
Countries Ranked by Total Output
| Rank (by MW total) | Country | Installed Solar (MW, 2024) | Annual Growth (2023–24) | W per person |
| 1 | 🇨🇳 China | 887,930 | 45.6% | 630 |
| 2 | 🇺🇸 United States | 177,470 | 27.5% | 522 |
| 3 | 🇮🇳 India | 97,384 | 33.7% | 68 |
| 4 | 🇯🇵 Japan | 91,610 | 2.8% | 745 |
| 5 | 🇩🇪 Germany | 89,943 | 20.1% | 1,071 |
| 6 | 🇧🇷 Brazil | 53,113 | 40.0% | 244 |
| 7 | 🇪🇸 Spain | 38,587 | 20.9% | 804 |
| 8 | 🇦🇺 Australia | 38,472 | 15.6% | 1,426 |
| 9 | 🇮🇹 Italy | 36,013 | 22.7% | 610 |
| 10 | 🇰🇷 South Korea | 26,645 | 13.4% | 512 |
| 11 | 🇳🇱 Netherlands | 24,048 | 13.0% | 1,336 |
| 12 | 🇫🇷 France | 21,528 | 23.7% | 331 |
| 13 | 🇵🇱 Poland | 20,199 | 23.0% | 532 |
| 14 | 🇹🇷 Türkiye | 19,883 | 76.1% | 229 |
| 15 | 🇻🇳 Vietnam | 18,667 | 0.4% | 187 |
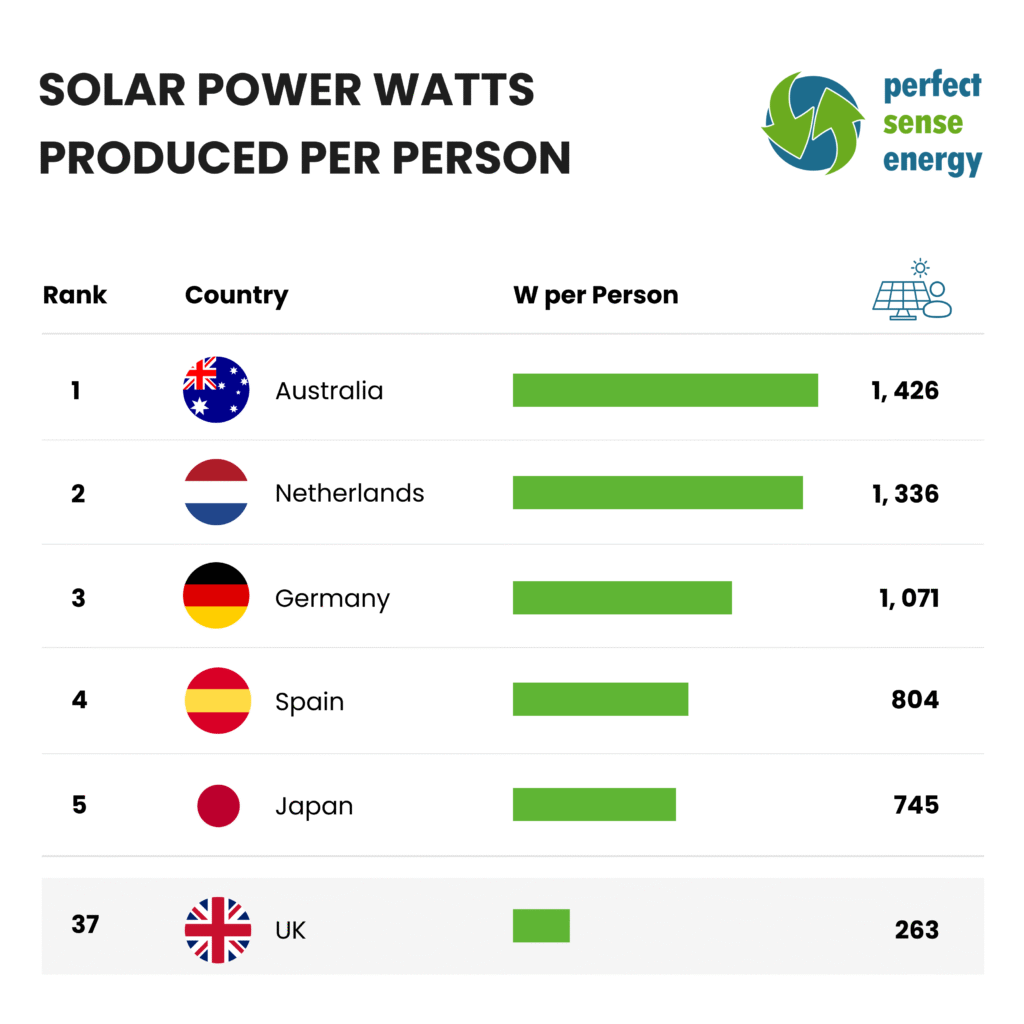
Countries Ranked by Watt per person
| Rank (by W/person) | Country | Installed Solar (MW, 2024) | Annual Growth (2023–24) | W per person |
| 1 | 🇦🇺 Australia | 38,472 | 15.6% | 1,426 |
| 2 | 🇳🇱 Netherlands | 24,048 | 13.0% | 1,336 |
| 3 | 🇩🇪 Germany | 89,943 | 20.1% | 1,071 |
| 4 | 🇪🇸 Spain | 38,587 | 20.9% | 804 |
| 5 | 🇯🇵 Japan | 91,610 | 2.8% | 745 |
| 6 | 🇨🇳 China | 887,930 | 45.6% | 630 |
| 7 | 🇮🇹 Italy | 36,013 | 22.7% | 610 |
| 8 | 🇵🇱 Poland | 20,199 | 23.0% | 532 |
| 9 | 🇺🇸 United States | 177,470 | 27.5% | 522 |
| 10 | 🇰🇷 South Korea | 26,645 | 13.4% | 512 |
| 11 | 🇫🇷 France | 21,528 | 23.7% | 331 |
| 12 | 🇬🇧 United Kingdom | 17,000 | 12.0% | 300 |
| 13 | 🇧🇷 Brazil | 53,113 | 40.0% | 244 |
| 14 | 🇹🇷 Türkiye | 19,883 | 76.1% | 229 |
| 15 | 🇻🇳 Vietnam | 18,667 | 0.4% | 187 |
| 16 | 🇮🇳 India | 97,384 | 33.7% | 68 |
Global Outlook
As the data clearly shows, the momentum behind solar energy is undeniable and accelerating, and each of these countries demonstrates a unique approach to scaling solar power.
Their success stories offer important lessons:
- Policy matters — consistent support mechanisms fuel investor confidence.
- Innovation thrives where public-private collaboration is strong.
- Geography helps, but it’s not everything; leadership is about will and strategy, not just sunshine.
While this list highlights five global leaders, the solar movement is bigger than any single nation. Countries like the Netherlands, Spain, and Brazil are rising fast, and developing economies are increasingly integrating solar to leapfrog into a more sustainable future.
Looking ahead, solar power is about powering the energy transition, creating green jobs, and building resilience in the face of climate change.
Thinking of going green? From solar installs to expert savings advice, Perfect Sense Energy tailors every solution to your business needs. Get in touch today to explore your options.
FAQs
1. Which country leads the world in solar power per person?
Australia now tops the global list, generating more than 1,400 watts of installed solar capacity per person in 2024. The country’s vast sunlight, widespread rooftop systems, and growing number of solar farms have created one of the most advanced solar markets in the world.
The Netherlands follows with around 1,300 watts per person, showing that size and climate are no barriers to large-scale adoption when policy and infrastructure align. Germany takes third place with roughly 1,000 watts per person, maintaining its reputation as a long-term renewable energy leader.
Spain and Japan complete the top five, both above 700 watts per person. Their steady growth highlights how clear national strategies and strong public support can drive solar power forward across different regions and economies.
2. Which European country leads in solar power per person?
Within Europe, the Netherlands remains firmly in first place, having overtaken Germany as the continent’s solar leader. In 2022, the Dutch surpassed 1,000 watts of installed capacity per person, up 28 per cent from the previous year.
Germany follows with 816 watts per person, while Denmark has risen quickly to third place with 675 watts. Belgium and Luxembourg round out the top five, both showing strong year-on-year growth. The entry point for Europe’s top ten continues to climb, with Portugal joining at 416 watts per person.
3. Where is the UK in this context?
The UK currently trails the leading solar nations, with around 300 watts of installed capacity per person in 2024. Growth has been steady, supported by falling installation costs and improving awareness, but slower grid connections and planning delays have held back faster progress.
That said, the potential is clear. As commercial and residential demand increases, and technology becomes more efficient, the UK could close the gap rapidly with stronger policy support and investment.
4. Why are some countries adopting solar power faster than others?
Countries adopt solar power at different rates due to a mix of government policy, grid infrastructure, financing options, public awareness, and geographic advantages. Nations with strong incentives, stable regulatory frameworks, and access to cheap financing tend to scale solar faster—regardless of how sunny they are.
5. Is solar power cost-effective compared to fossil fuels?
Yes, in many parts of the world, solar is now the cheapest source of electricity, often beating coal and gas. The levelized cost of electricity for solar has dropped more than 80% in the last decade due to technological improvements, mass production, and falling installation costs.
6. Can solar energy fully replace fossil fuels?
Solar energy alone can’t replace fossil fuels in all sectors, but it can supply a significant share of electricity needs. For a full transition, countries must combine solar with wind, storage (like batteries), smart grids, and other clean technologies. Solar is a critical piece, not the whole puzzle.
7. What challenges do countries face when expanding solar power?
Key challenges include:
- Grid integration issues during peak production
- Land use conflicts in densely populated regions
- Intermittency (solar doesn’t generate at night)
- Supply chain dependencies, especially on imported solar panels
- Solutions include investing in storage, flexible demand, and domestic manufacturing.
8. How can businesses benefit from investing in solar?
Businesses can benefit from solar through:
- Lower electricity bills
- Tax incentives and subsidies
- Improved sustainability credentials
- Energy independence and stability
- Many also install rooftop solar or enter power purchase agreements (PPAs) to reduce upfront costs while going green.
sources